08 Dec Multi-wavelength Observations
What does multi-wavelength observations mean?
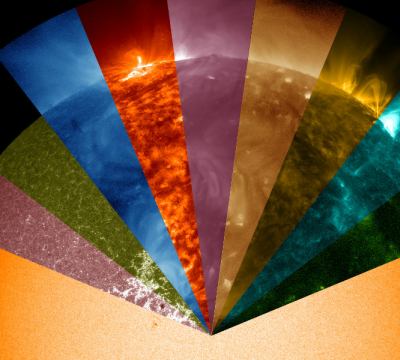
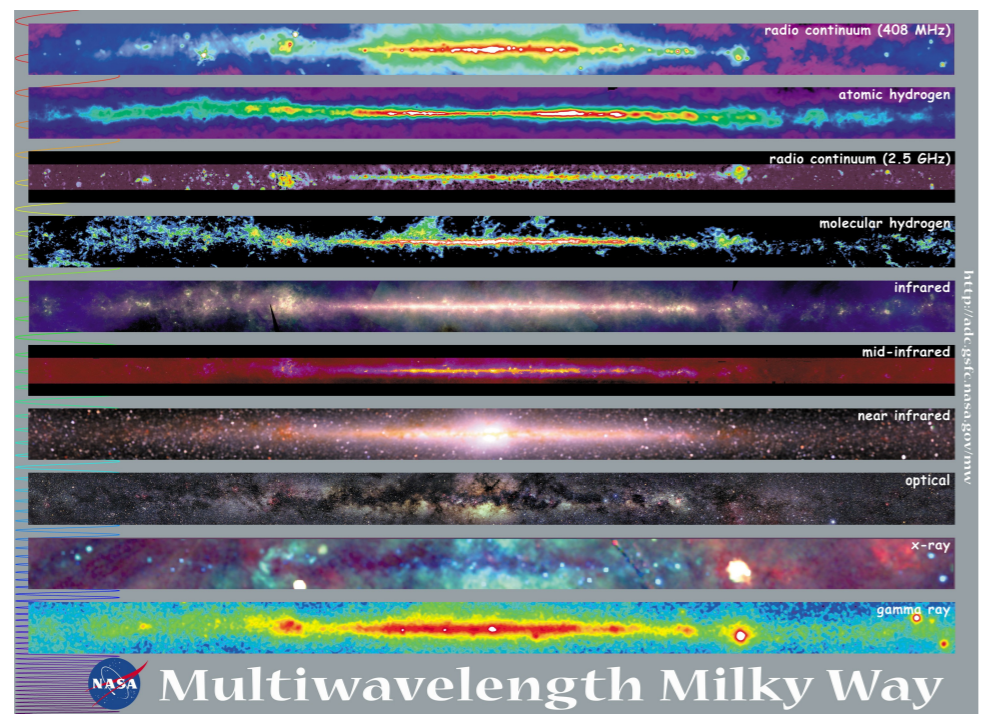
The illustration above shows our own galaxy in a variety of wavelengths. See the descriptions in the top right of each individual image to know in which wavelength range each was observed. It starts with a low energy (long wavelength) range and increase in energy as you move downwards through the images.
The optical picture should look more familiar, since that is how our eyes could see it in good conditions (if we were able to expose for a few seconds like cameras can). Our Milky Way has a very distinctive bulge in the near infrared because light travelling at those wavelengths can easily pass through the dense dust clouds that obscure it in other wavelengths. The spiral arms of our galaxy (where young stars are born) are beautifully visible in all the pictures, although they also suffer obscuration by their own dust in the optical wavelengths. And then there are bright features in some images that are not so prominent in others. See the bright spot that shows up in the x-ray and gamma ray wavelengths? That is a high-energy source. Accreting black holes are such sources.
Black holes were discovered when astronomers started studying the night sky using x-ray detectors. The first such detectors were launched high into the atmosphere in rockets or balloons, but later satellites were launched to study the universe in that particular wavelength range. Our atmosphere blocks x-rays (a good thing since prolonged exposure is harmful to humans) so to study them you have to get your detector above the atmosphere. There are several x-ray satellites orbiting the earth.
Accreting Black Holes

There are stellar mass black holes that are in binary pairs with companion stars. See the illustration for an artist’s impression of such a system where the yellow/orange star is the companion. Material flows from it’s surface toward the black hole (which is infinitely small and therefore invisible) and because they are orbiting around each other, the material swirls like water draining from a bathtub as it plunges down the gravitational well that the black hole creates in space. The in-spiralling material releases photons with increasing energy (coloured red, then blue and eventually white) as it moves ever closer to the black hole. We call this an accretion disc because material is being accreted into the black hole, thereby growing it in mass while the companion loses mass. When a large amount of mass is transferred in this way the system can become a microquasar, launching extremely energetic jets perpendicular to the accretion disc and increasing it’s brightness dramatically. These systems are also known as Black Hole binary systems.
One such system (BW Cir) was observed in optical and x-ray wavelengths. The x-ray data were obtained from the SWIFT, INTEGRAL and NuSTAR satellites. Simultaneous optical observations were done with SALT using the Berkely Visible Imaging Tube (BVIT), a visiting instrument currently occupying the auxiliary port on the telescope. The detector is capable of tagging every photon received to nanosecond accuracy, but requires a large collection area (i.e. a 10 meter class telescope like SALT) due to the low quantum efficiency of micro-channel plates (MCPs) in comparison to the more regularly used Charge Coupled Devices (CCDs). This allows us to bin photons together in 1 millisecond intervals, which is among the highest time-resolution achievable in the world.
After combining all the data and analysing it for correlations between the variations in brightness in the different wavelengths, PhD student Mayukh Pahari from the Inter-University Centre for Astronomy & Astrophysics and the University of Southampton (supervised by Poshak Gandhi) and various co-authors (including myself), published the results in:
http://adsabs.harvard.edu/abs/2017MNRAS.469..193P