03 Nov Fabry-Pérot
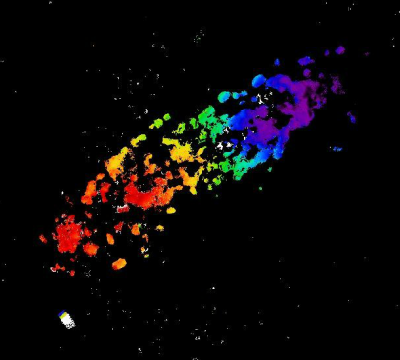
A velocity map of the galaxy NGC 1325.
Spectroscopy is the most important tool for an astronomer. It unlocks the hidden characteristics of objects too remote to be studied directly – things like the chemical composition of stars, the temperature, pressure and motion of interstellar gas clouds, the structure and mass of galaxies, and much more. A spectrum is the measurement of the brightness of the light coming to us from an astronomical source, at each individual colour, or wavelength. Think of a totally unromantic analysis of a rainbow, and you get the picture. Astronomers use the term “resolution” to describe how finely the light is divided into its colours; a high-resolution spectrum can measure hundreds of thousands of colours!
A spectrograph is the instrument that is attached to a telescope to measure spectra. The most common form of spectrograph accepts light from only a single point or along a single line from the image that a telescope produces. This is fine if you are interested in an object like a star, which is just a single point of light as seen by even the most powerful telescope. But what if an astronomer wants to measure the spectrum everywhere in an extended object, like a glowing cloud of gas or an entire galaxy? This is the realm of “imaging spectroscopy”, and it requires a specialized type of spectrograph. SALT, the largest optical telescope in the Southern Hemisphere, is rare among the giant telescopes of the world in that its Robert Stobie Spectrograph has an imaging spectroscopy mode. This is accomplished with a device called a Fabry-Pérot interferometer. It can efficiently produce spectra covering SALT’s entire field of view.
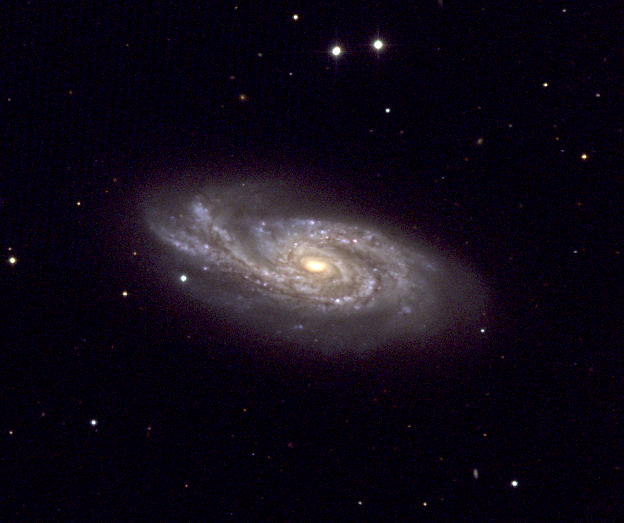
The galaxy NGC 908. SALT’s Fabry-Pérot system has simultaneously measured the spectrum of all the stars and gas in this galaxy.
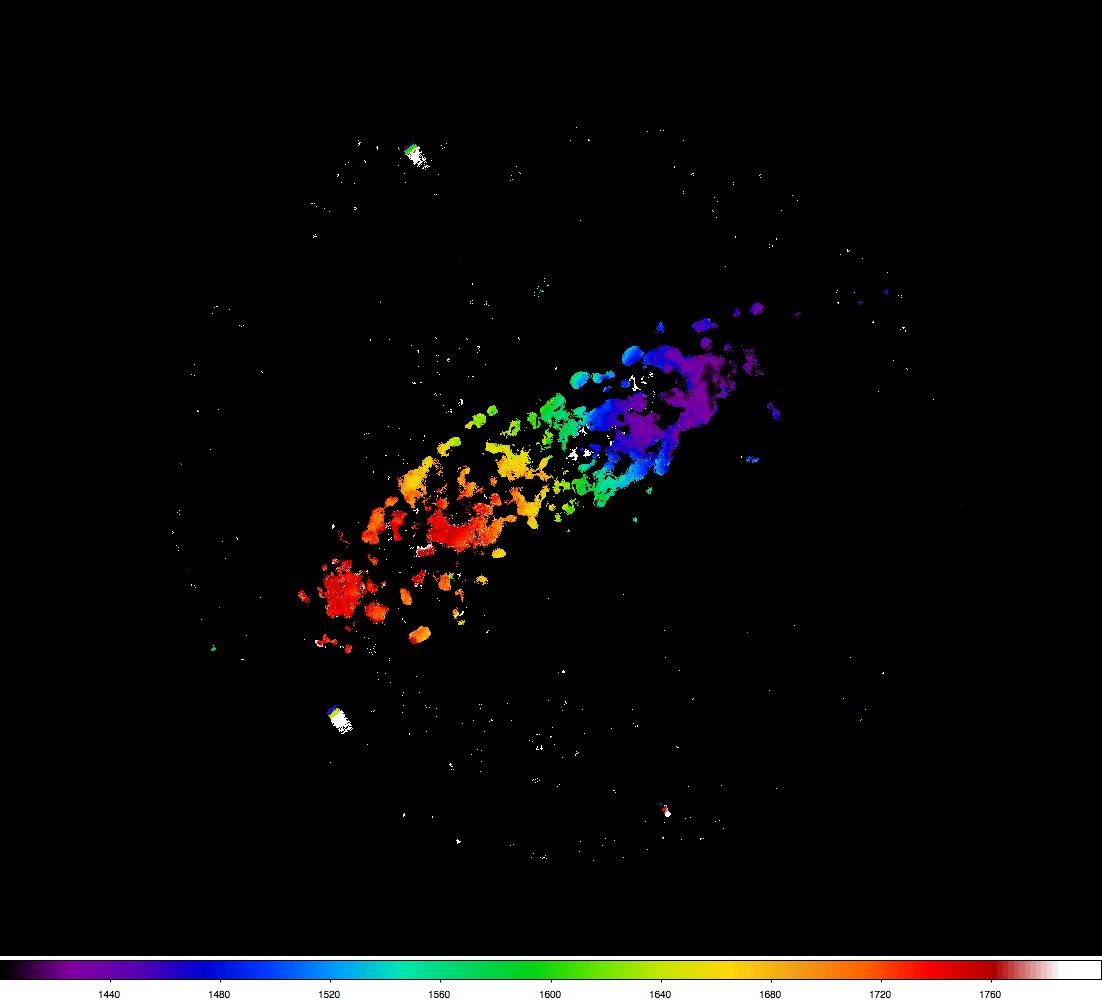
A Fabry-Pérot interferometer is essentially a tunable filter that produces a narrow-band image at one or a series of wavelengths that you specify. SALT has three etalons (the optical part of the Fabry-Pérot) that can give spectral resolutions of 300, 600, 1500, or 9000 over the wavelength range of 430 to 900 nm covering the entire 8 arc-minute diameter field of view of the RSS. A typical observing program takes a series of images covering a 2 to 4 nm spectral range of interest for the particular target. Figure 1 below shows an example of FP data of the Ha emission of the galaxy NGC 1325, taken on 02 November 2011 in the medium resolution (R 1500) mode. The upper left panel is taken at central wavelength 659.7 nm, the upper right at 660.1nm, and the lower left in nearby continuum at 663.1 nm; exposures are 90 seconds each. You can see the effect of the galaxy’s rotation, Doppler shifting the emission of the HII regions. The velocity map of the galaxy, generated by fitting all 23 images in the series, is shown in the lower right panel. A sample spectrum of one of the HII regions is shown in Figure 2, with fits to the Ha and [NII] lines. There are over 10,000 such spectra measured in the data cube, extending to a radial distance of more than 12 kpc (40,000 light-years) from the center of the galaxy.
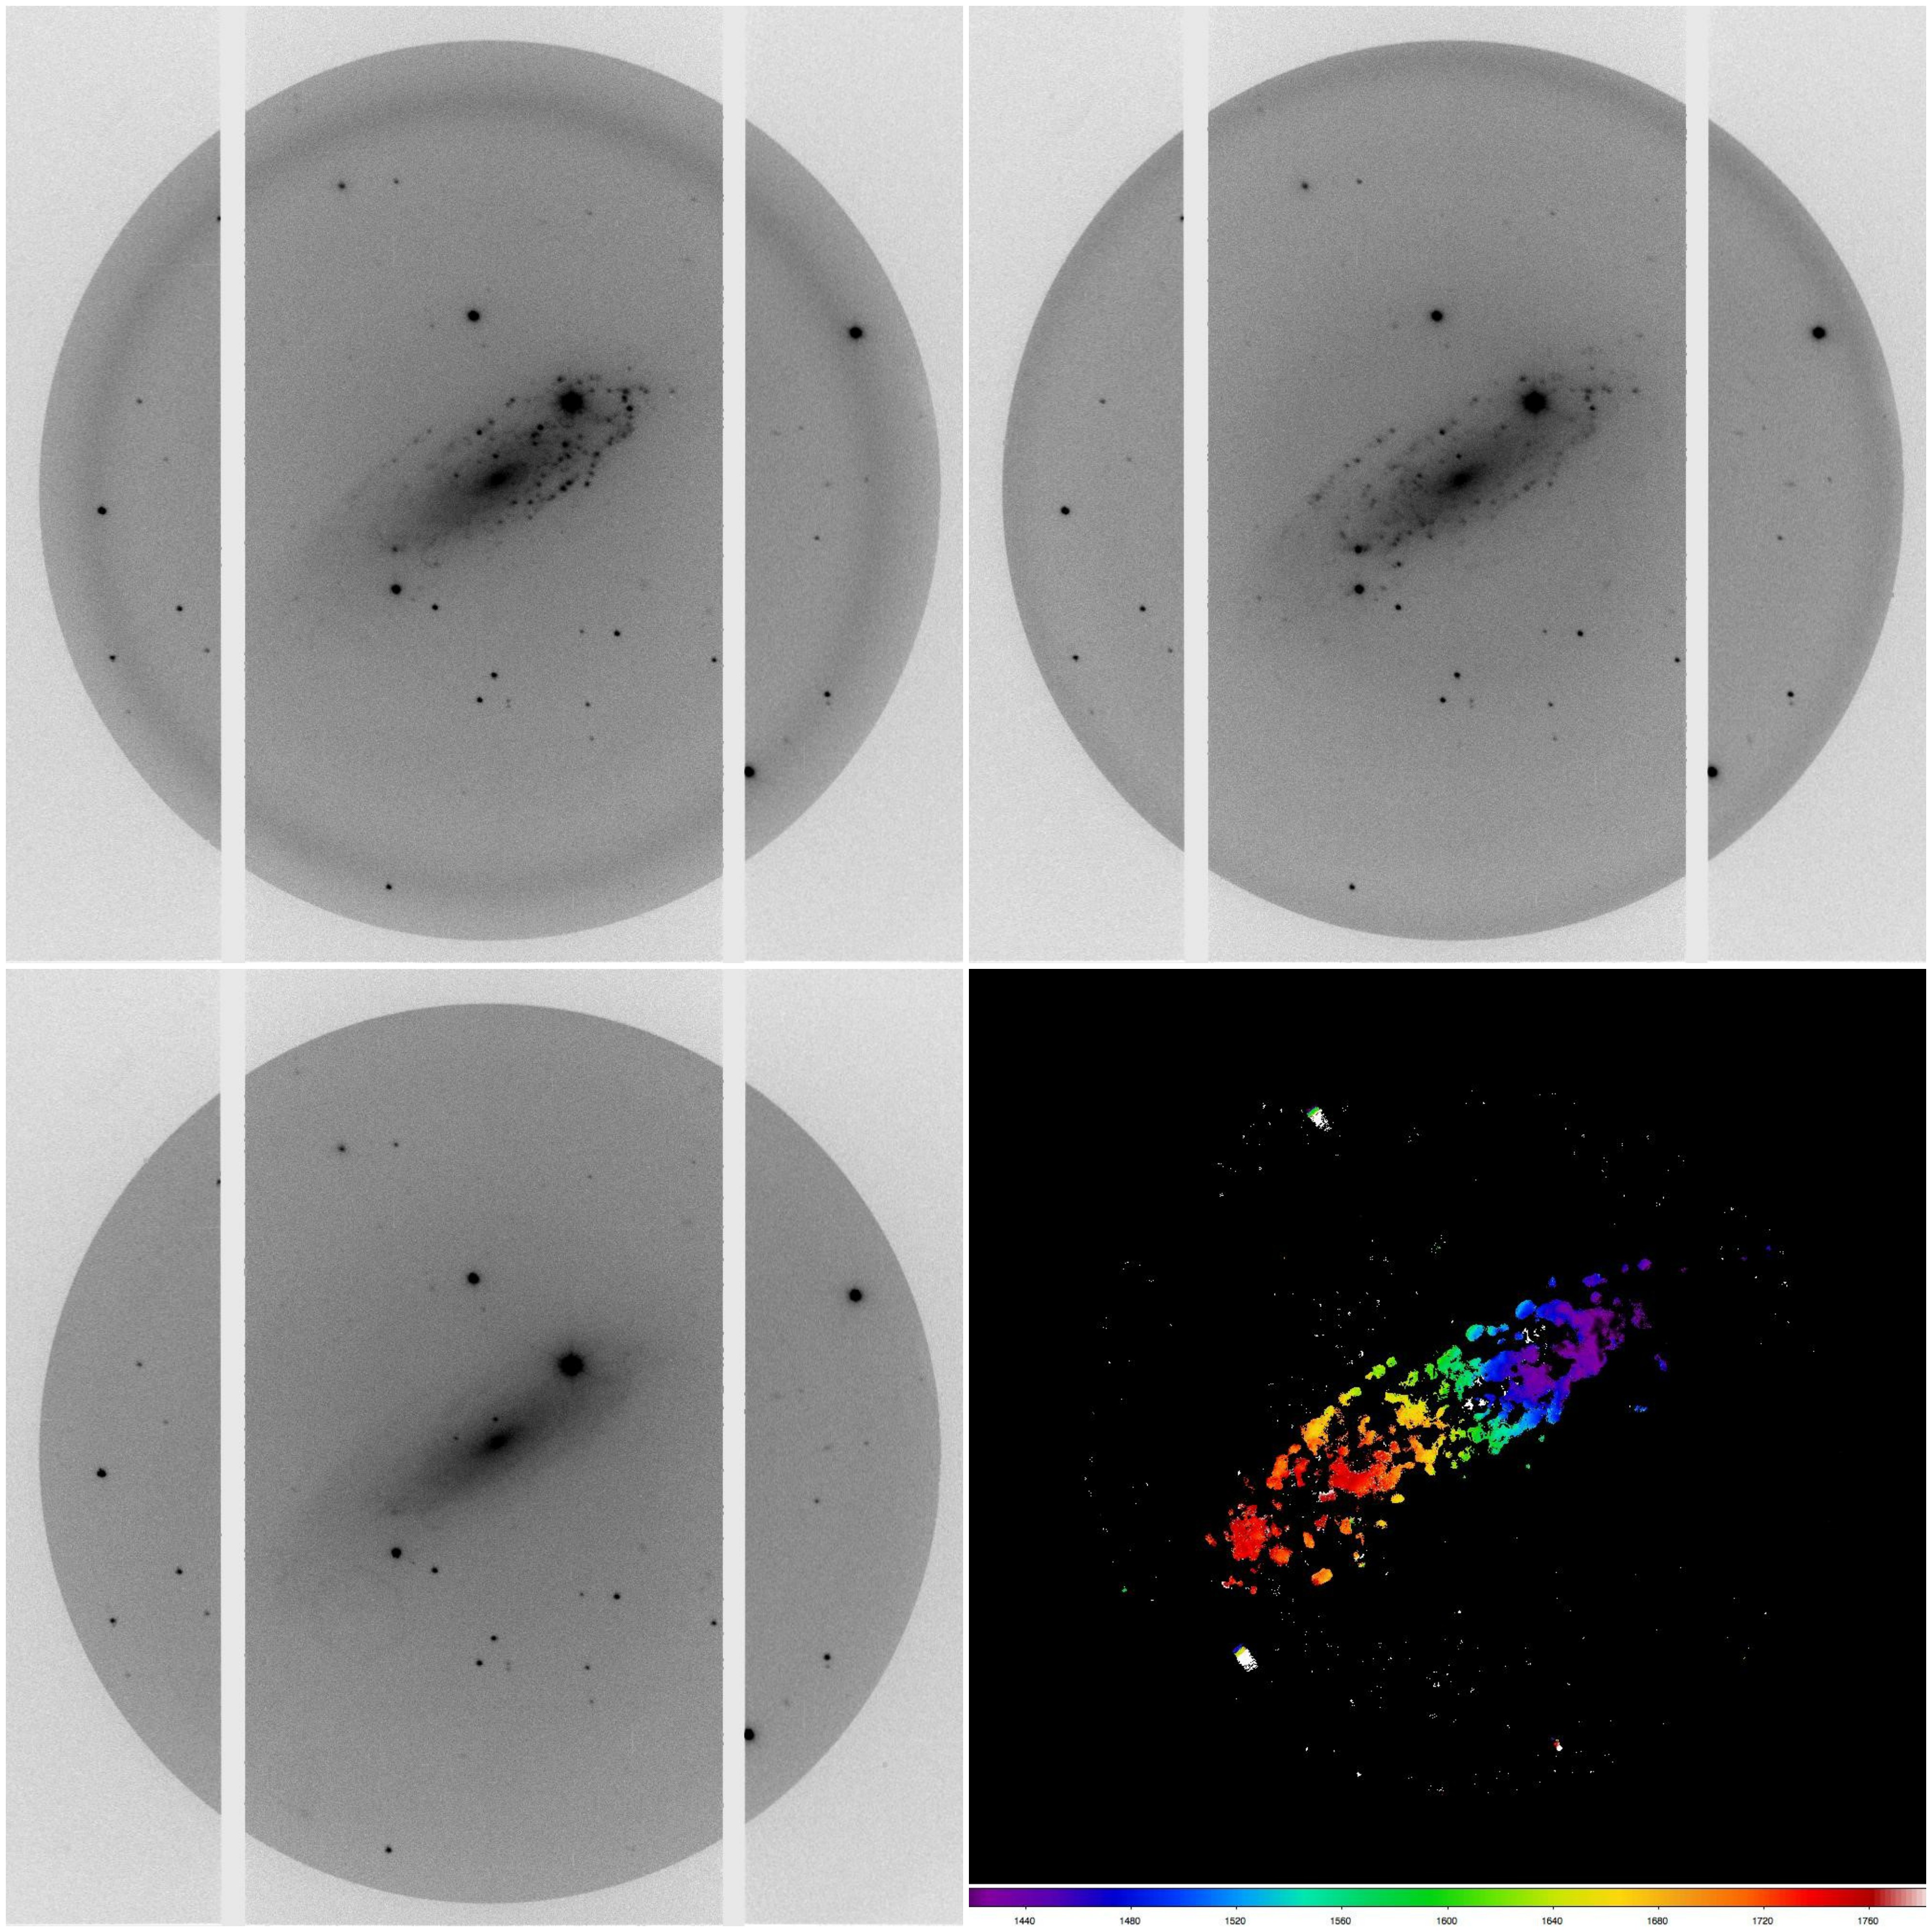
Figure 1. Fabry-Pérot observations of the galaxy NGC 1325.
In addition to the emission from the galaxy, you can see fuzzy ring-shaped emission in the images in Figure 1. These are night sky spectral features, arising from OH radicals in the Earth’s atmosphere. Since their wavelengths are accurately known, they can be used to provide a precise wavelength calibration for the data.
The steps in reducing FP data are typically: a) clean the cosmic rays, b) correct for an internal ghost reflection, c) flatten the data using twilight sky flats, d) measure the brightness of the foreground stars and use this to correct for the varying collecting area of the telescope, e) measure the night sky rings, then subtract them from the data, and finally f) fit the spectra point by point, to extract maps of line strength, velocity, and line width. Then of course, use these maps to pursue your scientific goals. There are software programs available in a not-quite-ready-for-prime-time state to accomplish all these reduction tasks.
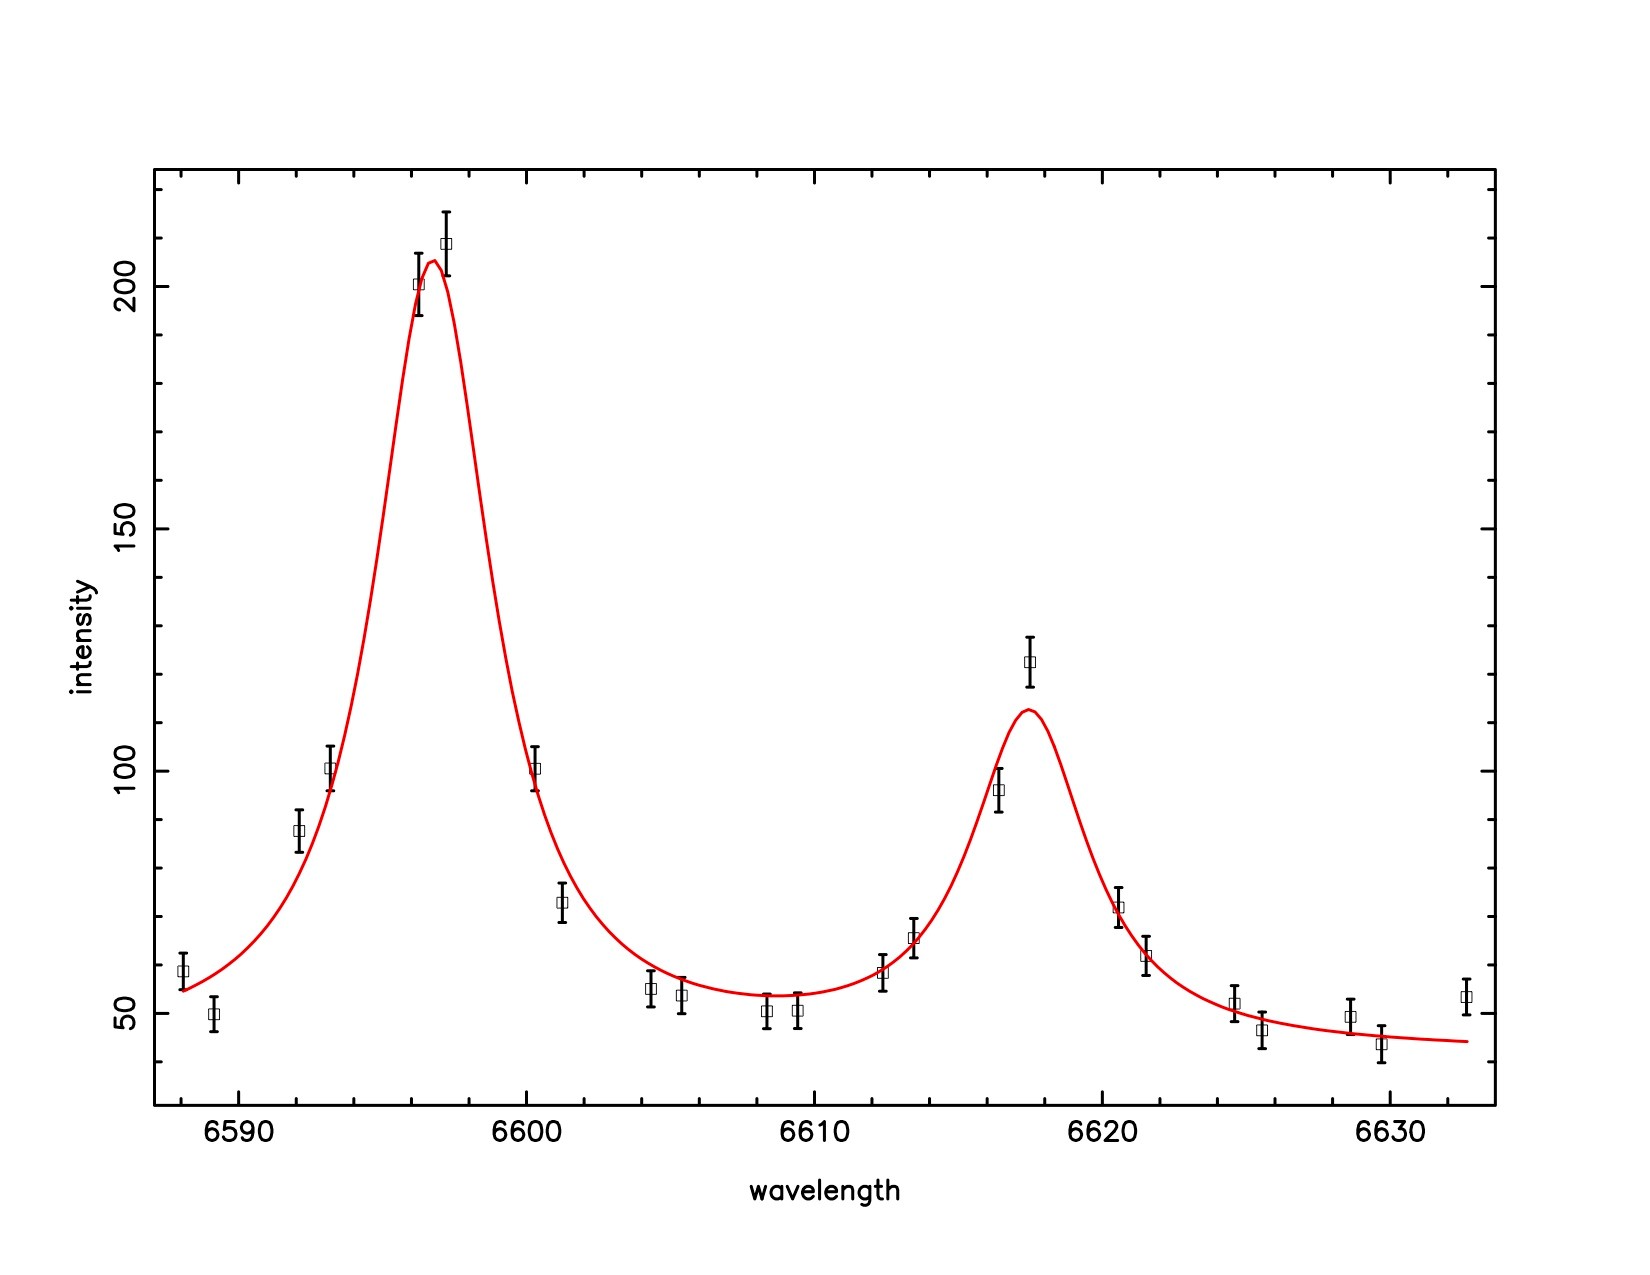
Figure 2. Spectrum of one HII region of NGC 1325
As of September 2017, the RSS FP system is working in its TF, LR, and HR modes (tunable filter, low resolution, and high resolution). The MR (medium resolution) etalon has suffered environmental damage over the years and is currently being refurbished by the manufacturer in the UK – we hope to have it back on-line in 2018. The two higher resolution modes, MR and HR, use two etalons in series to isolate individual spectral features properly. Because of mechanical instabilities that produce a particularly nasty reflection between the two etalons, we have had to resort to using a circular polarizer to eliminate the problem. This unfortunately reduces the throughput of the HR system by a factor of three, requiring longer exposures. We have a fix planned that should restore full sensitivity that should be in place in 2018. Fortunately, the TF and LR modes are unaffected by this problem and have their full throughput.
There is full documentation of the RSS FP system on the SALT web pages, and the PIPT supports the preparation of FP observing proposals. Like most tools, the FP is really good for some tasks, but the wrong solution for others (cf. hammers and screwdrivers). The FP aficionados on the SALT staff are happy to consult and offer advice about the use of the system – contact Ted Williams, Encarni Romero Colmenero, or Blaise Tapsoba.